On February 16th, we started an open experiment on the transactional emails we send within our Foundation Forum. We changed a number of things, cleaned up the emails, *made them more personal, all with the goal of improving our click through rates and increasing engagement within the Foundation Forum. With our current focus on improving the way the world builds emails, we decided to do this experiment in public so that we both share our learnings and learn from the community about how to improve our emails. We received some really interesting, in-depth feedback on how we could have better set up the experiment and a number of unknowns that might throw things for a loop. Even so, we decided to let it ride as it stood and see how things turned out.
Now that we've let the experiment run for a couple of weeks, let's dive in and see what happened.
Overview of the Results
From Feb 18 to March 3, we sent 989 emails to the experimental group, with a 60.8% open rate and 19.2% clickthrough rate. We also sent 573 emails to the control group, with an 62.3% open rate and 31.9% clickthrough rate.
Whoa, What Just Happened!?!
We certainly weren't expecting that! We were expecting the new emails to get a better clickthrough rate than the old!
Digging deeper, let's look at the distribution of emails that got sent. There were significantly more emails sent to the experimental group (989) than the old group (573)' but we were supposed to be testing a random equal distribution. What happened?
When setting up an experiment like this, you have to make a decision about how you're going to distribute who gets what. You could do it completely randomly on a per email basis, vary it by post, or vary it by person. We chose the last, with the thought that each individual user should get a consistent experience. And on a per-user basis, things were pretty balanced, with 152 users in the experimental group and 154 users in the control group. The problem with this approach is that we have some power users in our system.
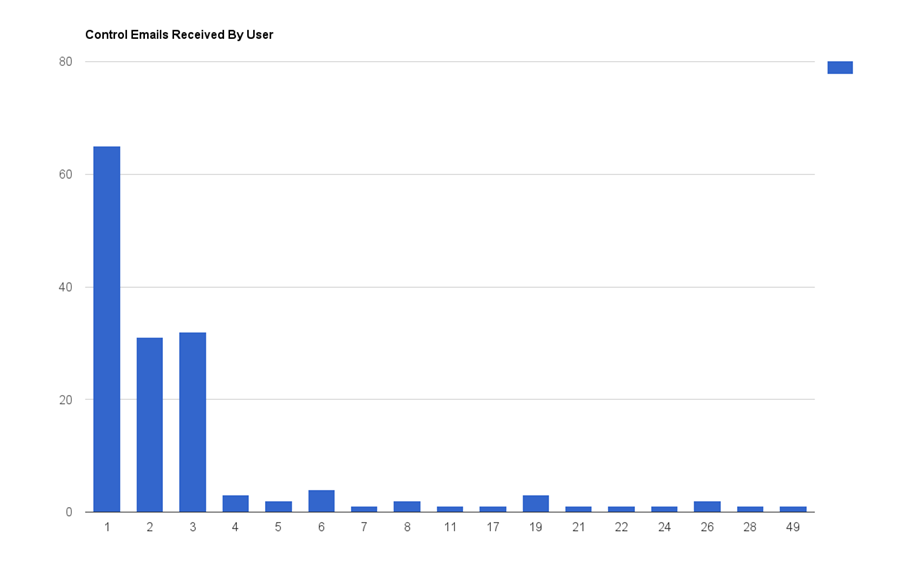
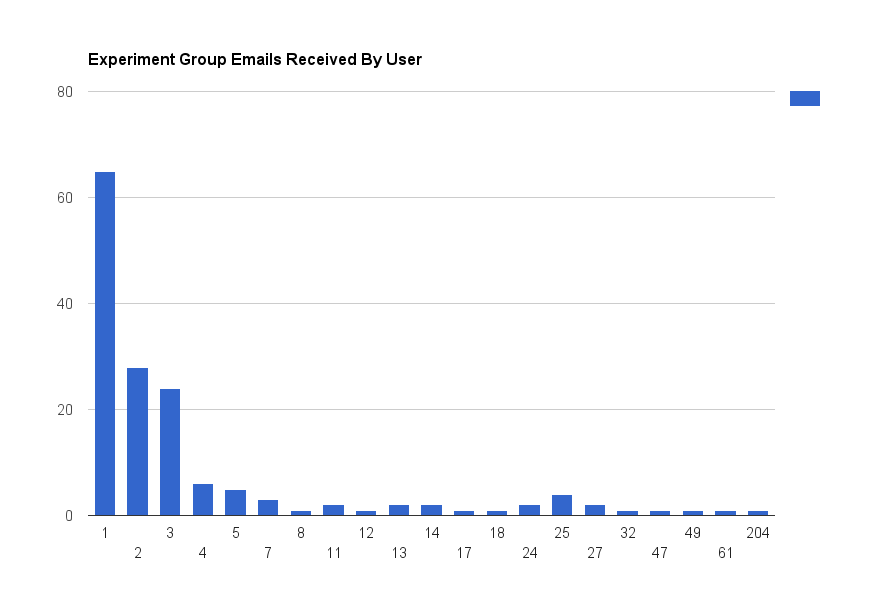
Let's look at some histograms of how many emails a particular user received for each of these conditions:


As you can see, the majority of users in either condition received between 1 and 3 emails, but in both cases have a long tail. In the experimental case, we had a power user to the extent where a single user received 204 emails within the 2 week period of the test! No wonder our numbers sent were a bit skewed' and it is easy to imagine that a user like that probably isn't clicking on as high a percentage of emails as user just receiving one or two - they may just live in the forum and see the responses in real time!
What happens if we factor out the impact of power users, perhaps only looking at users who received 5 emails or less? In the experimental case, this trims us to 217 emails, with a 54% open rate and a 19.3% clickthrough rate. In the control case, we're at 235 emails a 64.6% open rate, and a 37.8% clickthrough rate. Even more extreme!
So What's Going On?
Based on our data we can pretty definitively conclude that click through rates are lower with the new version of the emails. That wasn't what we were expecting, but in retrospect this comes back to something that Ethan asked in response to our first blog post:
'... what problem are you trying to solve and how will you know you've fixed it?'
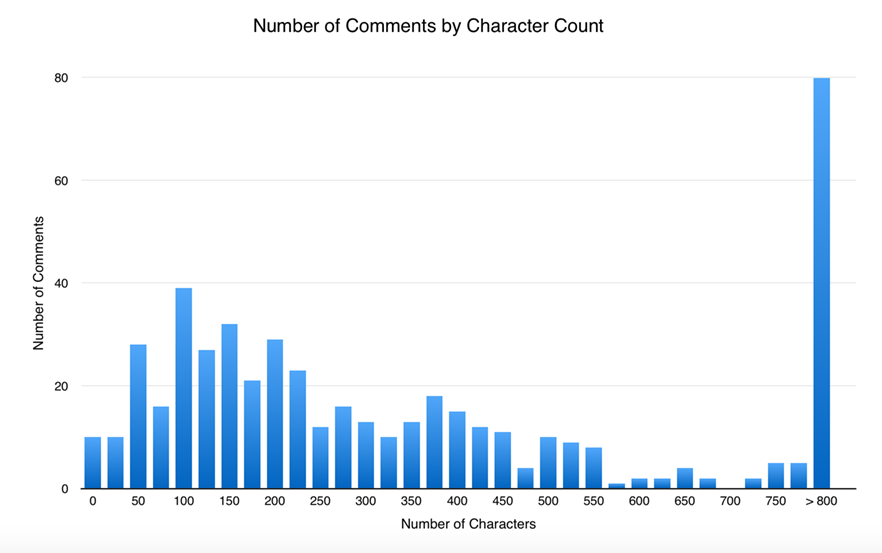
The thing that we're trying to accomplish is to get more folks engaged in and replying in the forum, but the data that we're measuring is click through rate, which is only an imperfect proxy for that. One of the most visible changes we made in the email was we started showing much more of the message directly in the email - we shifted from showing up to 75 characters to up to 400 characters directly in line. What if a fair number of people were just clicking in order to be able to read the whole message? Lets look at a quick distribution of the text sizes of the emails sent in our experiment time period.

As you can see, expanding the limit from 75 characters to 400 characters dramatically increased the number of comments that were completely visible from within the email. At 75 characters, 10% of the comments were completely visible from within the email, while at 400 characters that number goes up to 65%.
Unfortunately, we didn't set up the data in a way that we can easily dig into clickthroughs at different comment sizes, but this seems like an extremely plausible answer as to why our outcome wasn't exactly what we were expecting.
Moving Forward
This experience highlights how important it is to be careful and precise in what we're measuring in an experiment. We need to carefully ask 'What is the question we're answering?', and 'What data will accurately convey an answer to that question?'. As we saw here - we thought we were asking one question 'Can we get more people to respond to forum posts?' and instead ended up getting an answer to 'Do people click less if they can see all of the content within their email?'.
It also highlights how experimentation is a process, not a single activity. The outcome of an experiment is an insight, not a perfect result. We can move forward, asking new questions, optimizing for new things, and keep the process rolling. As we wrap up development on Foundation for Emails 2.0, we're excited to make the creation of emails quick and easy so that your organization can do similar experiments to optimize your content. When the pain is taken out of HTML emails, it frees up time and resources to dedicate to improving engagement, helping us reach our goals and move our organizations forward.
What's Next?
We'd like to understand if the new emails are actually creating a better experience - and more value - for the users of Foundation Forum. We've seen that they generate fewer clicks, but have a new hypothesis that this is because people are more able to see an entire response without clicking. How can we measure if this is a better experience?
Our thought is to identify a list of users who have received both emails (i.e. were receiving the old emails before, and are receiving the new emails now), and send them a quick survey using Notable Tests to ask their thoughts. The reason for this is we now believe the difference is more qualitative rather than quantitative, and a survey might capture that more. But it's not immediately clear this is our best way to get at this. What do you think? How would you test for this? See you in the comments!