It's election time folks, which explains why we've been bombarded with all sorts of polls from both sides of the political aisle. They all claim to be fair and bias-free yet they all seem wildly contradictory. Is it really that hard to get the real, honest answers or is it inevitable that some amount of bias will color the data?
As designers, we work to fight against our own thoughts and opinions and eagerly seek those of our users. Having a process for collecting feedback regularly certainly helps, but nothing beats good ol' fashion user testing. The faster and more regularly we can get honest and uncolored feedback from our users, the faster we can get to the right solutions and ultimately better the best design.
To help us get feedback and validate our design decisions, we've spent years building tools like Verify and Notable Tests that make it easy to get our work in front of lots of people, and analyze their feelings on it. Big companies like Disney, Google, HP, Salesforce and eBay dug'em too. But this election season has made us take a deeper look at how we look at polls, the 'facts' they elicit, and what we could do to minimize bias is our user testing.
For example, when a friend or family member sends you the results of a poll, how often do you ask them how the data was collected before forming an opinion on it yourself? That matters. Alot. The New York Times recently reported of a man from Illinois who was allegedly (and unknowingly) being given 30 times the weight of an average respondent due to his being a member of a small demographic, and the only one in the demographic to respond. This caused a presidential poll to completely flip flop based on the individual's change in preference from one candidate to the other.
In that case the data was made available by the organization running the poll, and the bias was not intentional. However, intentional or not, bias is hard to account for, and the 'who' and the 'how' of what we ask when conducting tests is often more important than the answers. And, while this is certainly true in context of the elections, you may want to take a moment to ponder how this affects the evaluation of your design work as well.
What makes polling scientific?
When we're trying to validate design decisions, there are a number of factors we need to consider: the work itself, sample size, demographics, variables, etc' But how often do we really stop and think about all the bits and pieces that make polling 'scientific'? According to Gallup, 'A scientific, non-biased public opinion poll is a type of survey or inquiry designed to measure the public's views regarding a particular topic or series of topics. Trained interviewers ask questions of people chosen at random from the population being measured.'
Sounds fair but wait...
'A scientific, non-biased public opinion poll'. Let's stop there, aren't opinions by nature expressions of bias? I'm confused, but let's table that thought for now. The next interesting bit is, 'Trained interviewers ask questions of people chosen at random from the population being measured.' Seems like another oxymoron: 'people chosen at random from the population being measured'. How can a population that you specifically chose to measure be truly random? What's the deal here man!?
The Framing Effect
Everyone of us has some sort of bias, and due to the nature of bias, we are very likely unaware of it. Cognitive Bias is just as important to understand when it comes to polling, or validating designs, because we take our bias with us to the polls. For me, I grew up an angsty punk rocker who thought the man was trying to keep him down. When I read the first sentence about polls from Gallup, my bias caused me to react prematurely and misconstrue the evidence in front of me (i.e I affected an assumption that the wording seemed exclusionary). This in turn caused me to relay the information to you in a way that transferred some of my bias to you (that or you called my bullshit right off; +1 for you).
The phenomenon described above is similar to what is known as the 'Framing Effect'. Essentially this means that depending on how the information is presented, regardless of its content, people draw different conclusions. It's scarily easy for this bias to be manipulated. Some pollers have been accused of asking leading questions. This brings us to the true subject of this article, and our hypothesis: The way you ask a question, affects the answers you get.
Robin Williams vs Adam Sandler
Now, take that small little example and think about how this kind of bias, intentional or otherwise, affects the way we create, distribute, and measure the results of tests. Here's a silly nonpartisan example of a poll/test in the simplest form, 'Adam Sandler or Robin Williams?'. What's your answer? Stash that, what's the question? Well, as they say in college, 'the preponderance of evidence suggests'' that the poller is asking, 'Which do you prefer, Adam Sandler, or Robin Williams?'.
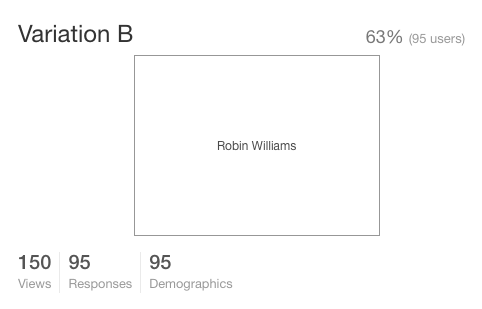
Let's take this silly example to the nth degree and send the Williams v. Sandler test to 150 randomly selected users. The answers come in, 63% say they prefer Robin Williams, 37% prefer Adam Sandler. Looks like Adam is the clear loser here (you were right Adam, they're all gonna laugh at you).

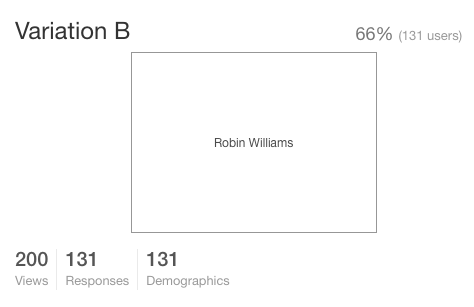
Suppose though, for a second, that you had instead asked the question, 'Whose movies do you like best, Adam Sandler, or Robin Williams?'. One might assume the distribution would be somewhat similar, but why? Couldn't the original question have been misconstrued to mean something entirely different? Like who is hotter, Adam Sandler, or Robin Williams? We sent the same test with the new verbiage to 200 users, and the results were surprisingly similar.

The Mere Exposure Effect
In the example of Williams v. Sandler, it appears that there is enough context in popular culture to understand the simpler question to be the same as the more complex without the added context. Because of this, we'll likely see little deviation between the two sets of tests. This is also an indication of prior bias, though not in the way we normally think of it. This is called the 'mere exposure effect', where people tend to express a liking for something purely because of their familiarity to it. Several of our test respondents literally said, 'I am more familiar' as an explanation of their choice.
At first we might think that's okay in this test, because we didn't ask who IS better, we asked who do you prefer. But in the first test we provided no such context, other than the mechanics of the test itself, A or B. Left without additional context perhaps people default to 'mere exposure bias' and choose what they know.
We're not sure we've really proven anything just yet. The hypothesis we went into these two rounds of tests with was that context matters. Instead, we found that in the case of Williams v. Sandler it didn't matter how you phrased the question. Though if we had intended to ask who has the better kung-fu we could expect the results of the first test would have been completely erroneous.
Setting a Different Context
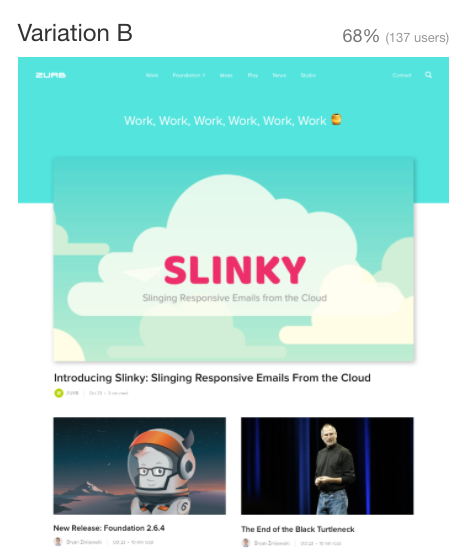
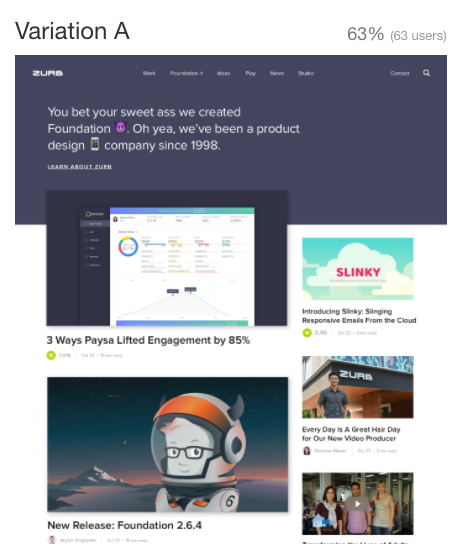
Let's look at an example where the context is not so obvious; let's do a test with two different website layouts. In this example, we sent out two tests with similar premise as the previous set. Our goal with these tests was to see which layout our users preferred for our new homepage redesign. In one test we asked the testees (giggle), 'Select the variation you prefer'.

In the other, we set up the question by starting with an introductory message, 'ZURB is a product design company that is known for their front-end web framework (Foundation) and their 20 years of experience designing websites and applications for clients like Netflix, Samsung, BAE, and Pixar'. Next, the testees (still giggling) were given this prompt: 'Of the two designs, which do you think better communicates who ZURB is and what they do?'.

The results above appear to support the hypothesis! If we dig more, and look at these results based on demographics, we could extract even more nuance. For example, in all versions of the tests we covered, filtering could change the outcome, pushing the result from predominantly A to predominantly B or vice versa. For example in both, respondents aged 25-34 preferred variation B.
We don't know for certain why some demographic groups found one variation more interesting than the other. Nor can we really say at this moment if the results could be considered 'statistically relevant', as we have not yet discussed what makes a result so. But clearly there are a lot more nuances to both conducting a user test and sifting through the data than many designers realize.
Frequentist Inference and Statistical Relevance
In our previous iterations of our testing application, we ended up erring on the side of what is known as Frequentist Inference when it came to measuring the results of our tests. In terms we can grock, Frequentist Inference states that all experiments of statistical probability and the observations made therein are independently relevant. So when we run an experiment, and get back an answer that 80% chose A, we considered the result to be statistically relevant; one could begin to make decisions based off that sole result. This allows pollers to sidestep the controversial subject of 'statistical relevance' and prop up a number in isolation that really has so significance at all in context.
In our own work, we later found that Frequentist Inference (while accepted) is an incomplete way to look at test results when it comes to design. As we demonstrated in the test examples above, the context of a test can be simple or complex; some things are more ubiquitous than others (like knowledge of celebrities), and others required a lot more context to even understand properly what was being asked (like design layouts).
Frequentist Inference ignores concepts like prior probability, posterior probability, and other factors that help to address the aforementioned unknown and unknowable context of any set of variables. This epiphany led us down the path of P-Values, Bayesian Statistics, inference, updating, and the even bigger question of induction vs. deduction. This epiphany gave us a temporary high, as we were delighted to be reminded that greater minds than ours have attempted to tackle this problem and failed. Where we would prefer to differ from our predecessors is when we fail, we'd prefer to fail fast (as opposed to waiting 100 years as the scientific community has done with P-Values for statistical relevance).
Okay, But Why Does This Matter So Much?
We've run you through the gauntlet here. Why do we care so damn much about tests, questions, and the answers they inspire? Why did we just unload on you a variety of hard-to-pronounce three syllable words like Bayesian and Frequentist?
Well, throughout our five years of developing testing apps, we've run thousands of our own tests, and have facilitated many more for our users. Never content to rest on our laurels, we have a burning desire to improve on our formula, and learn from the experiences our users have shared with us. Some of those experiences relayed have demonstrated that we've not yet properly accounted for the bias we described in the content above.
So, when embarking on this new version of our application, we wanted to take a critical look at our past experience with Verify and Notable Tests. Both were successful and did what they were planned to do well, but we know there is more we can accomplish. For starters, we never really addressed the problem of asking better questions. We've also learned that better questions, in absence of the right audience (which, as you'll recall from the Gallup definition, is important), isn't enough to help shape better answers. Put simply, this testing stuff is hard, and we want to make it as easy and accurate as possible.
Bringing Your Bias Into Our Learning
We're actively using our testing application to build our testing application. As meta as that seems, its working, and helping us get back to one of core principles, designing in the open. In fact, throughout the course of writing this article, and running the tests contained within, we stumbled upon more insights that will help us better shape the product.
We'd like you to help us build a better app too- by using it. To that end, we'd like to extend an invitation for you to join us in an early private release coming Nov. 15th. If you're interested in participating, sign-up below and one of our advocates will contact you in the upcoming weeks.
So, whether you're in a red state, or a blue state, for Hillary or Trump, put your bias behind you. Because regardless of your beliefs, all of you are welcome in the Purple State. And since it's election day, maybe you can run some exit polls of your own. And who knows, next time, maybe you'll be able to predict the outcome before it happens!
